In the past year, the platform team was tasked with setting up infrastructure and services to unify the company’s collection of disparate databases into distinct domain databases. These legacy databases served a wide array of business applications and ran on different RDBMSes. The overall objective was to eventually have a set of microservices each of which encapsulated a business concern, upon which teams could then build their applications and services. An interesting project. The challenge? It had to be done gradually without disruption to other teams’ applications. Until those legacy databases were retired, changes to any domain database needed to be streamed in realtime to them. Briefly, based on the initial requirements, we went with PostgreSQL to power the domain databases; Debezium to capture data changes in those databases’ Write Ahead Logs and forward them for targeted schema conversions with dedicated services via Kinesis.
After a couple of development iterations, to gain an insight into the performance of the service that polled the WAL, the service wrapper around Debezium was instrumented using Micrometer with the generated metrics scraped by an external Prometheus cluster. Subsequently, a Grafana dashboard was setup to visualize these. With the removal of a key requirement of maintaining the order of data changes transmitted downstream, the need for reading the WAL also changed as domain databases now each had a dedicated outbox to commit transaction summaries to. Naturally, the question became whether Debezium would still be necessary. It was not. The team would go on to prove that out by building a replacement containerized multithreaded service that polled the Outbox table and sharded the changes by tenant into Kinesis. A couple of interesting things of note happened here:
- Implementation was in .Net Core
- The instrumentation library changed to AppMetrics
- The metrics dashboard was updated to visualize the newly generated data
That’s quite a few changes. The curious Rustacean in me wondered how the performance of this service would compare if it was written in Rust to take advantage of the concurrent primitives and performance Tokio provides alongside Rusoto. Replicating it would be fairly straightforward, however, there was no avoiding the other two changes: a new language-specific metrics library and updating the dashboards all over again. How can all this be avoided, not just in this scenario but in an much wider context of rewrites of existing services but needing to preserve the existing instrumentation? Additionally, internal deliberations about the possibility of moving away from the APM vendor to an internally hosted Elastic solution was also another real factor for consideration. Incredibly, a new open source project OpenTelemetry had a lot of the answers to questions I was mulling.
OpenTelemetry
OpenTelemetry is a CNCF project that defines a language-neutral specification and provides a collection of APIs, SDKs for handling observability data such as logs, metrics & traces in a vendor-agnostic manner. This project was formed from the convergence of two competing projects- OpenTracing & OpenCensus and backed by major cloud providers from Google, Microsoft, Amazon and virtually all vendors in the observability space - Splunk, Elastic, Datadog, LightStep, DynaTrace, NewRelic, Logzio, HoneyComb etc. Let us explore the benefits of adopting OpenTelemetry for existing and future greenfield projects.
-
The OpenTelemetry Specification’s language neutrality allows for implementations in different languages. Currently, as of this writing, there are implementations for some of the most widely used general purpose languages provided by OpenTelemetry’s SIGs - Special Interest Groups: C++, .Net, Java, Javascript, Python, Go, Rust, Erlang, Ruby, PHP, Swift. These are a dedicated groups of contributors with a focus on a single language implementation. If there’s a software project using a language that is unsupported currently, chances are it will be supported in future. All this means a greater degree of flexibility when implementing software components; regardless of the language choice, instrumentation will be the same.
-
OpenTelemetry’s extensible architecture means that library/plugin authors can instrument their code with the API and when these artifacts are utilized in a service or application implementing the OpenTelemetry SDK, there is visibility into both the service code and third party libraries performance. Microsoft’s Distributed Application Runtime library is an example. There are plugins for popular frameworks like Spring, Express etc.
-
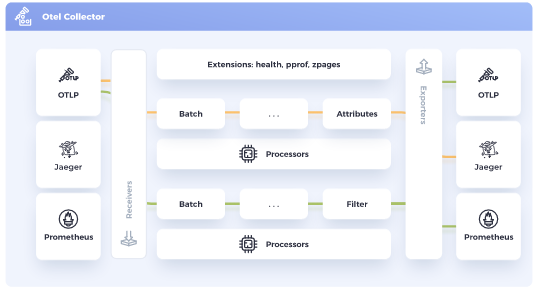
OpenTelemetry prevents vendor lock-in. The OpenTelemetry Collector allows for the reception, processing and exportation of telemetry data with support for different open source wire formats - Jaeger, Prometheus, Fluent Bit, W3C TraceContext format, Zipkin’s B3 headers etc. More so, with implementation of Exporters for different telemetry backends, switching between vendors is a breeze. For example, one can pipe their tracing data to NewRelic, Elastic, a deployed instance of Zipkin etc…and it is all a simple configuration change on the Collector. Think of it as instrumentation as a form of abstraction, where the destination backends for the telemetry data is abstracted away from the application/service.
-
With the stabilization of the Tracing Specification and the outline of the Metrics Roadmap, OpenTelemetry is shaping up to be the way to derive insights into distributed services. One library to trace, generate metrics and connect them to other telemetry data. Since it is also the CNCF project to replace OpenTracing & OpenCensus, for service meshes like Linkerd, OpenTelemetry will eventually become the de-facto way of propagating telemetry data from the various services. This means an easier transition when moving from a collection of microservices to a service mesh when the complexity warrants it.
Demo
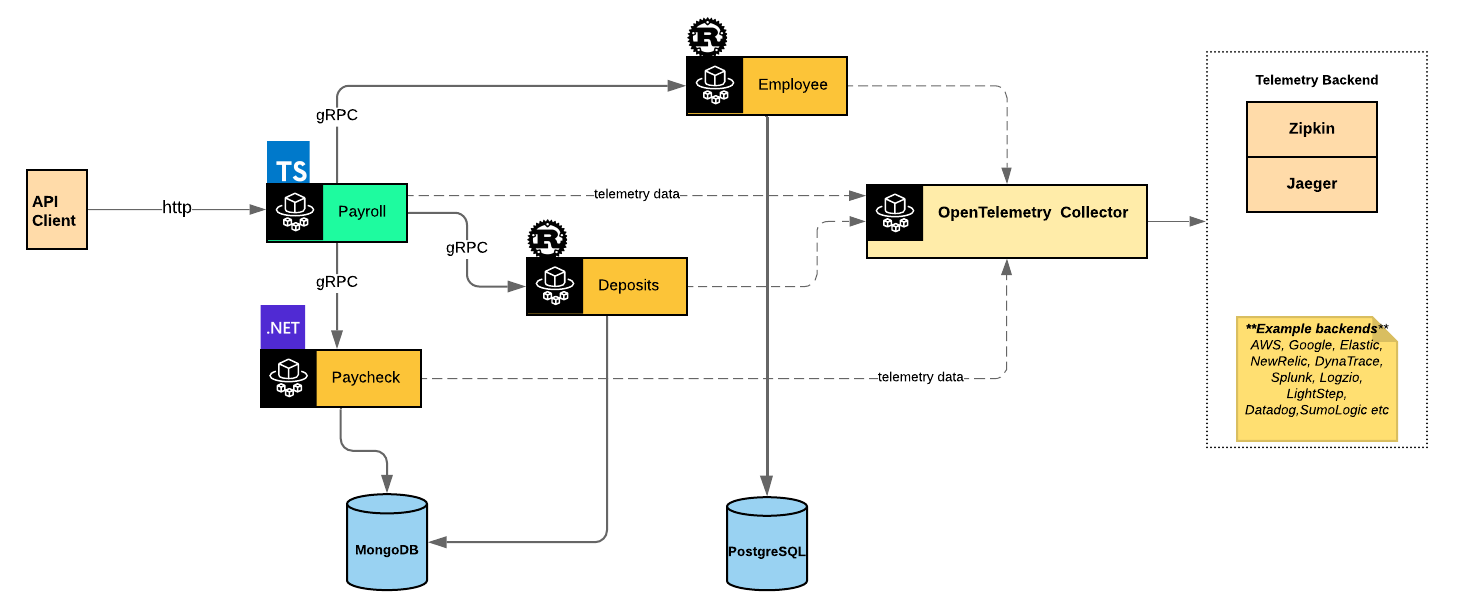
For a quick demonstration of the tracing capabilities, I have a demo built to showcase:
- support for multiple languages - chose Rust, Typescript with ExpressJS and .Net 5
- tracing across different communication protocols - HTTP & gRPC
- auto-instrumentation of services
- manual instrumentation of services
Rust is intentionally used for two services - Employee & Direct Deposits to demonstrate manual instrumentation with synchronous and asynchronous functions as the data layer each service works with offered a sync API, in the case of Diesel with PostgreSQL and an async API via MongoDB’s Rust 2.0-alpha driver. Typescript, comes along for the ride since it’s one of the languages I use server side. .Net5 is latest language iteration from Microsoft, so I had a side interest in taking a peek at its comparative performance to Rust again.
With OpenTelemetry, one can auto-instrument code and/or apply manual instrumentation. This gives flexibility when working with legacy codebases or starting greenfield projects by allowing teams to auto-instrument applications first and then for deeper insights into areas of the code that might be of interest later on, apply the instrumentation manually.
From the demo code, I instrumented the .Net5-based Paycheck service as follows:
public static void ConfigureTracing(IServiceCollection services)
{
    // Necessary for OpenTelemetry Collector communication since traffic is unencrypted for demo purposes
    AppContext.SetSwitch("System.Net.Http.SocketsHttpHandler.Http2UnencryptedSupport", true);

    services.AddOpenTelemetryTracing((builder) => builder
        .AddSource("paycheck-db-conn")
        .AddAspNetCoreInstrumentation()
        .SetResourceBuilder(ResourceBuilder.CreateDefault().AddService("paycheck-service"))
        .AddOtlpExporter(options =>
        {
            var otelCollectorUri = Environment.GetEnvironmentVariable("OTEL_COLLECTOR_URI") ?? "http://localhost:4317";
            options.ExportProcessorType = ExportProcessorType.Batch;
            options.Endpoint = new Uri(otelCollectorUri);
        }));
}
Here, under the hood, OpenTelemetry for DotNet sets up the auto-instrumentation via AddAspNetCoreInstrumentation() and uses the System.Diagnostics.ActivitySource to setup a custom event sink named paycheck-db-conn for handling the manual instrumentation later as seen below:
public class PayRepository : BaseRepository<Pay>, IPayRepository
{
    private readonly ActivitySource _activitySource;
    public PayRepository(
        IMongoClient mongoClient,
        IClientSessionHandle clientSessionHandle) : base(mongoClient, clientSessionHandle, "paychecks")
    {
        _activitySource = new ActivitySource("paycheck-db-conn");
    }

    public async Task<IEnumerable<Pay>> GetAllPaychecksAsync()
    {
        var span = _activitySource.StartActivity("GetAllPaychecksAsync");
        List<Pay> result = null;
        try
        {
            result = await Collection.AsQueryable().ToListAsync();
            span.AddTag("paychecks.count", result.Count);
        }
        catch (Exception ex)
        {
            span.AddEvent(new ActivityEvent($"Call Failure. Reason: {ex.Message}"));
            throw;
        }
        finally
        {
            span.Stop();
        }

        return result;
    }
A trace is simply a collection of spans. In the above, we start a child span of the parent span and annotate it appropriate via tags & events. Events represent occurences that happened at a specific time during a span’s workload. Together, the additional metadata drives quick insights when investigating problems. For example suppose we got the following api response on an attempt to load all paychecks:
{
    "statusCode": 500,
    "message": "Server ist kaput!",
    "developerMessage": "Internal Error",
    "requestId": "451b8025562676951540a00cc121af04"
}
With the requestId (aka the global traceId) above, we see how the additional metadata which we applied to the span helps us to understand a request error as the request is propagated across different service and network boundaries.
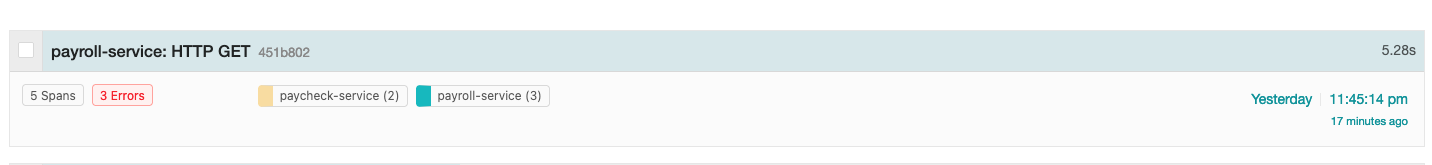
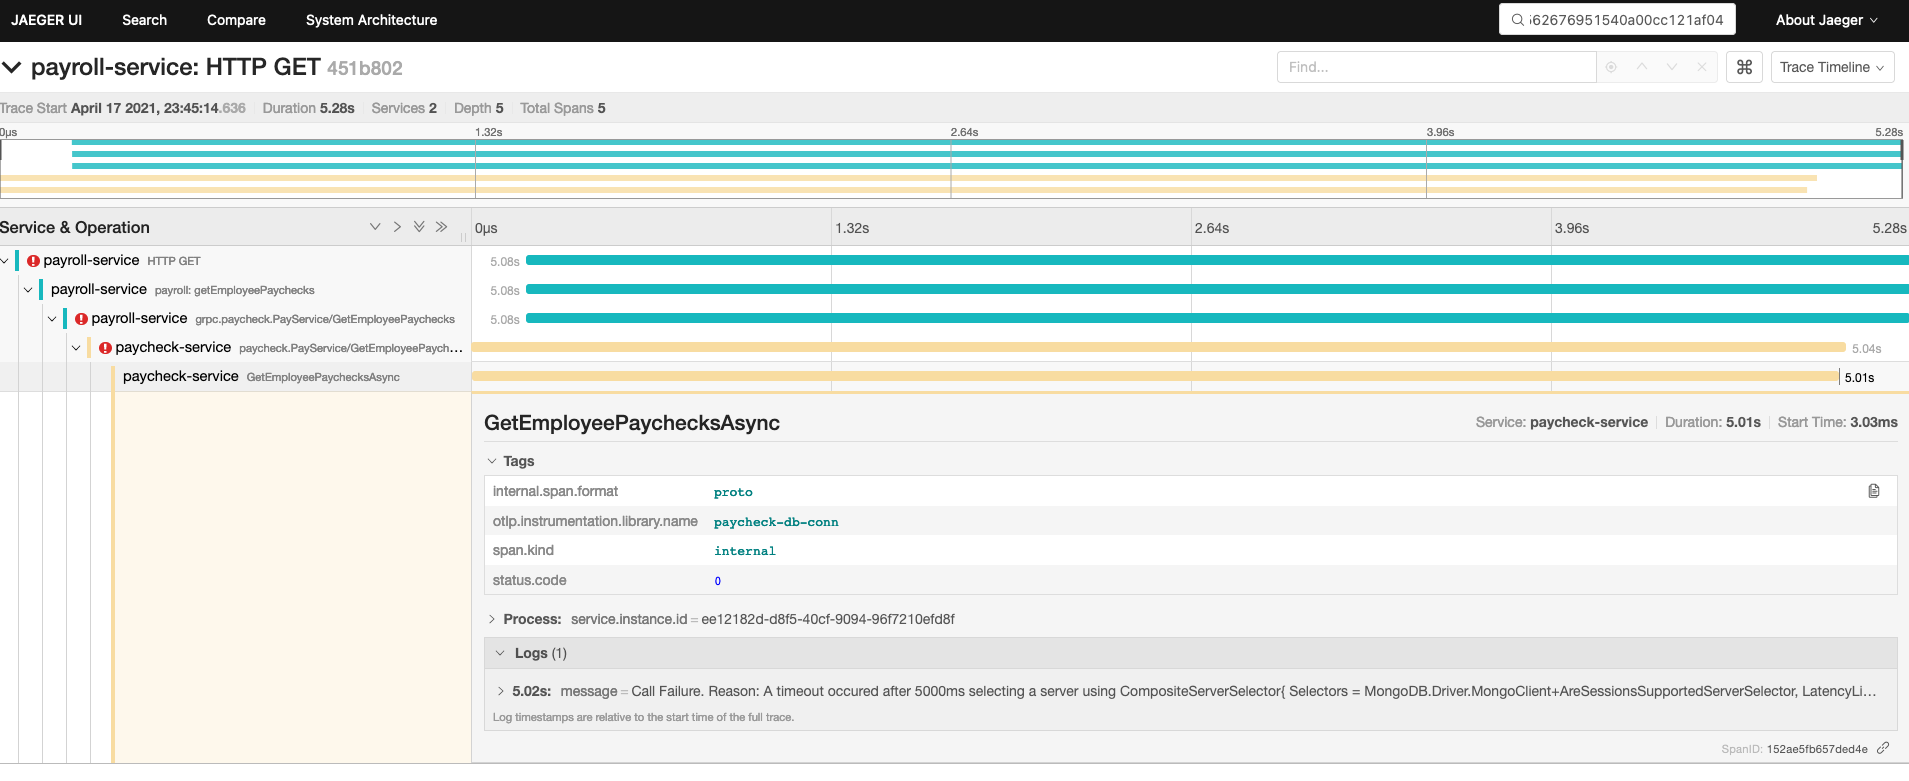
In this case, a database connectivity problem!
We apply a similar pattern to both Rust-based services: Employee & Direct Deposit. Below, we pull the propagated trace context and use it to further build child spans around database calls.
#[tonic::async_trait]
impl EmployeeService for MyEmployeeService {
    async fn get_all_employees(
        &self,
        request: Request<()>,
    ) -> Result<Response<GetAllEmployeesResponse>, Status> {
        let parent_ctx = tracing::get_parent_context(&request);
        let tracer = global::tracer("employee-service");
        let span = tracer.start_with_context("get_all_employees", parent_ctx);

        let db_result = tracer.with_span(span, |_cx| -> Result<Vec<Employee>, error::Error> {
            let db_client = EmployeeDb::initialize()?;
            db_client
                .get_employees()
                .map(|employees| employees.into_iter().map(model_mapper).collect())
        });

        match db_result {
            Ok(employees) => Ok(Response::new(GetAllEmployeesResponse { employees })),
            Err(_) => Err(Status::unknown("unable to load all employees")),
        }
    }
Similarly, for the Payroll service:
/**
 * Gets an employee's paychecks
 */
 employeesRouter.get('/:employee_id/paychecks', (request: Request, response: Response, next: NextFunction) => {
    const span = tracer.startSpan('payroll: getEmployeePaychecks');

    const employeeId = request.params.employee_id;
    api.context.with(api.setSpan(api.context.active(), span), async() => {
        const traceId =  span.context().traceId;
        try {
            const results = await paycheckService.getEmployeePaychecks({employee_id: employeeId});
            response.send(formatResponse(results.paychecks));
        } catch (err) {
            next(createError(...[convertGrpcToHttpErrorCode(err)], {
                developerMessage: getGrpcErrorMessage(err.message),
                traceId
            }));
        } finally {
            span.end();
        }
    });
});
Collector Deployment, Pipelines & Telemetry-backend Configuration
There are two modes of deploying the OpenTelemetry Collector:
- agent: where the collector instance is running on the same host as client application
- gateway: where one or more collector instances run as a standalone service.
The Collector serves as centralized point to allow for the configuration of telemetry data reception, processing and exportation to desired telemetry backends. In our demo configuration as shown below, we pushed trace data in batches that was received via HTTP & gRPC, through a trace pipeline setup to export the data to the Jaeger and Zipkin instances we deployed for analysis. Although commented out, the traces could have been sent to NewRelic as well. There are many supported vendors with the Collector. This makes it easy to compare the depth of analytics that various vendors can provide given the same telemetry data.
receivers:
  otlp:
    protocols:
      grpc:
      http:
        cors_allowed_origins:
        - http://*
        - https://*

exporters:
  jaeger:
    endpoint: jaeger-all-in-one:14250
    insecure: true
  zipkin:
    endpoint: "http://zipkin-all-in-one:9411/api/v2/spans"
#   newrelic:
#     apikey: <<NEW_RELIC_INSIGHTS_KEY>>
#     timeout: 30s

processors:
  batch:

service:
  pipelines:
    traces:
      receivers: [otlp]
      processors: [batch]
      exporters: [jaeger, zipkin]
      #exporters: [zipkin, jaeger, newrelic]
Through pipelines, metrics and eventually logs data will be exported through the collector thus making OpenTelemetry the one library for applications’ observability needs. Additionally, with the Collector pipelines, one can ship various telemetry data to different vendors. If desired, one can ship their metrics data to a vendor like Splunk and still use DataDog for traces and logging. OpenTelemetry opens up the possibilities…
Links
The demo code for the above can be found here